The Grötzsch graph is the smallest graph without triangles that cannot be 3-coloured.
I’ve played around with various drawings of it and found the following, which I’m quite happy with:

It’s not the obvious layout; the articles at Mathworld and Wikipedia contain drawings that are more standard and arguably do a better job at visualising the structure of the Grötzsch graph. Another drawing, due to David Eppstein is at at Wikimedia commons.
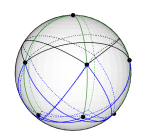
“My” embedding is a projection on the plane of an embedding of the Grötzsch Graph on the unit sphere:
-
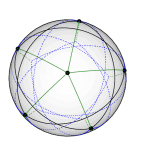
- Viewed from North
-

- Viewed from South
-
- Viewed from the side
(I really need to make an animation of this.)
The central vertex of the 2D drawing sits at the top of the sphere; the pentagram-like group of 5 vertices sit slightly above the equator, and the last five vertices (placed no the outer rim in the 2D drawing) are on the southern hemisphere. It turns out that in this embedding, the unit vectors defined by these points are at internal angles of more than 120 degrees, so the embedding describes a vector 3-colouring in the sense of [David R. Karger, Rajeev Motwani, Madhu Sudan: Approximate Graph Coloring by Semidefinite Programming. J. ACM 45(2): 246-265 (1998)]. This shows that the Grötzsch graph (which is 4-chromatic) can be vector 3-coloured.
I find this quite neat.
I found the 3D embedding by actually running an semidefinite programming solver to find a solution to the vector colouring problem. The output of such a program is of course just a bunch of vectors (in 11 dimensions), but it turned out that the solver was friendly enough to only use the first 3 dimensions. After some headscratching and bumbling attempts at visualising the vectors in various mathematical software packages that I understand only feebly, I managed to make sense of the embedding so that I can now draw it neatly.
(I did a similar thing for the Chvátal graph, but I can’t make any sense of the resulting vector 3 colouring.)
